Are you grappling with mysterious errors on your Divi website and feeling clueless about how to tackle them? Fret not! I’ve got an uncomplicated method that can help you uncover and understand these issues. Checking your browser’s console for errors might sound technical, but I assure you it’s simpler than you think. Before you go seeking help from others, why not give it a shot yourself? This step-by-step tutorial is designed especially for beginners who might not be familiar with the console in the browser developer tools. I’ll walk you through the entire process of checking your Divi website’s Console for errors. Intrigued? Let’s dive in!
Console Error Checking: An Important Troubleshooting Skill
Understanding how to troubleshoot website issues is crucial, and one essential skill is checking the browser Console for errors. Surprisingly, many folks aren’t familiar with it. As someone who often assists users with technical support for my plugin, I’ve noticed that many questions could’ve been easily answered if they had checked the console first. That’s why I’m writing this tutorial for beginners who may not know about the Console in their browser’s developer tools. In this guide, I’ll walk you through how to check the Console for errors on your Divi website.
How to Open the Console in Your Browser
If you want to access the browser developer tools and check the console for errors on your website, here’s a simple guide. Just right-click anywhere on your webpage, and a menu will pop up. Look for the “Inspect” option at the bottom and click it. This action will open the developer tools panel on either the side or bottom of your screen.
Alternatively, there are shortcut keys to access this feature, but they vary depending on your browser. Generally, you can press F12 or use Control-Shift-J on Windows, or Command-Option-J on a Mac. These methods make it easy for you to delve into the console and identify any issues.
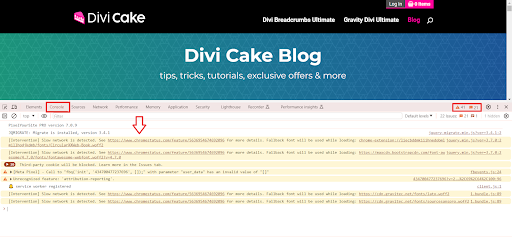
When you open your browser’s tools, you’ll notice several tabs at the top, such as Element, Network, Console, Performance, and more. You can adjust the window size or use a small menu to uncover extra options. Typically, the “Console” tab is the second one you’ll find, and it’s the one you’re interested in.

Open the Console in Your Browser
Examining Console Warnings and Errors
When you open the Console, you might find a bunch of new stuff you didn’t know about how websites work behind the scenes. It can feel overwhelming at first, but don’t worry, you don’t have to understand everything. This tutorial will cover the basics, which are super useful if you’re building websites.
Yellow Warnings
You might see yellow warning icons, which are like caution signs. They’re not as urgent as the red ones, but they’re still worth paying attention to. One common warning you might see is about mixed content, which we talked about fixing in another tutorial. For example, if it’s a mixed content issue, the error message will mention something about loading a page over HTTPS but requested an insecure image over HTTP.
Red X Warnings
Then there are the red x warnings, which are more serious. They usually mean there’s a problem with JavaScript. It could be something in Divi or a plugin you’re using. When you see one of these, try to figure out what it’s telling you.
Read More: Beginner’s Guide to WordPress: Step-by-Step Tutorial (2024)
Follow The Path
A couple of quick tips: Sometimes the warning will give you a clue about where the problem is. For example, it might mention a specific file or line of code. Recently, a customer contacted us about an error, but I could see from the warning that it was coming from the Divi Theme. If they had checked that first, they could have saved us both some time. This is a common thing we deal with in support, so I hope this tutorial can help others too.
Exploring Different Kind of Errors in Your Divi Website
Another common kind of issue is related to server errors, such as the 500 error, 504, 403, and more. If you encounter these errors in the Console, a simple solution is to type them into any search engine to find information about them. Often, resolving these issues requires checking your server requirements and reaching out to your hosting provider’s support for assistance.
Conclusion
Congratulations! You’ve just taken a significant step toward mastering the art of Console Error Checking for your Divi website. Unraveling the mysteries behind those perplexing errors no longer needs to be a daunting task. By following this straightforward guide, you’ve equipped yourself with the skills to troubleshoot and identify issues within the Console.
Understanding the importance of checking the Console for errors is not just for the seasoned developers but for anyone managing a Divi website. The Console serves as your diagnostic tool, providing insights into warnings and critical errors that may impact your site’s performance.
Remember, the journey doesn’t end here. As you delve into the Console, pay attention to the yellow caution signs and red x warnings. Each warning carries valuable information, guiding you to potential solutions for issues like mixed content or JavaScript problems.
By following the path outlined in this tutorial, you’re not only resolving immediate concerns but also building a foundation for better website maintenance. Your newfound knowledge can save you time and streamline communication with support teams if needed.
Don’t shy away from exploring different errors, including those pesky server errors like the 500 error, 504, or 403. Using search engines to understand and address these issues, coupled with checking server requirements and seeking support from your hosting provider, will empower you to navigate through challenges confidently. Embrace the troubleshooting journey, and remember, each error is an opportunity to enhance your website’s performance. Happy debugging!
Read More: Optimizing Images for SEO in Divi: A Guide


0 Comments